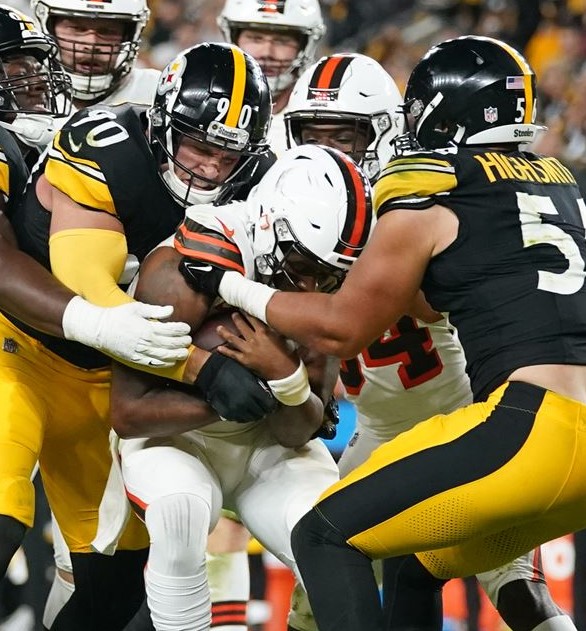
Did the Steelers actually hold Worilds back?
Our grouchy football uncle Ed Bouchette posted this in his slog this morning.
Worilds told me after six games that he was not rushing the passer as often as he did last season, so I went to Pro Football Focus to see how they had it. They do a good job of charting the number of plays, and they break down when a defender rushes the passer or covers a receiver on passing downs. After six games, according to their count, Worilds rushed the quarterback 57.1 percent of the time. Last season, he rushed 79 percent of the time.
After six games, Worilds told me this about having to cover receivers more often in 2014 than he did in 2013, “I would hope that they know that I rush the passer, so if they put me out of position, they do it knowing that they’re taking me out of position to make plays.”
Since then, Worilds has rushed the quarterback more often and his percentage is up to 69.8 rushing and 30.2 covering for the season. That still pales to last season’s 79 percent rushing (an 11.6 percent drop), but it’s a lot more than the 57.1 he had after six games. The numbers after 14 games for Worilds, according to PFF: 372 pass rushes, 161 pass coverages.
So, armed with what I can assume is fairly accurate info on snap counts and pass rush opportunities, I decided to see how productive Worilds has been since the change in week seven.
While only using averages based upon games played and total opportunities to rush (total pass plays); Worilds was rushing the passer approximately 21.7 times per game in the first six weeks. Since then he has rushed the passer approximately 30.2 times per game and dropping approximately 7.8 times per game (or rushing the passer approximately 79% just like last year), bringing his average up to almost 70% on the season. How has his productivity changed since week six, I wondered.
Well, as the chart below illustrates, he’s not even doing as well getting to the QB as he was doing in weeks one through six. And, with an average of 9 more opportunities to get to the QB per game, he’s out of excuses.
Assuming the pass rush stats are correct and there has been a marked uptick in Worilds pass rush opportunities, he is no better after getting more opportunities than he was when he was rushing the passer less frequently.
In the first six weeks, Worilds had 2 sacks and 7 QB hits combined. That averages to 0.333 sacks per game and 1.1667 QB hits per game.
In the ensuing eight games, when he has dropped back less frequently and rushed a lot more often, he has a combined 2.5 sacks and 5 QB hits. That averages to 0.31 sacks per game and 0.625 QB hits per game.
In other words, since becoming the Steelers primary pass rush threat in week seven, Worilds is actually less productive. Oh, and he makes $10M this season.
Again, for the guys holding onto the belief that the Steelers have held Worilds back. Worilds has been given a lot more opportunities since week six and his effectiveness has actually dropped. He has had one “franchise” type game this year in 14 weeks. It was the Saints game where he recorded 5 solo tackles, 5 assists, 1 sack, 2 tackles for loss, no passes defensed and a QB hit.
| week | tackles | assists | sacks | TFL | PD | QB hits | INT |
| 1 | 3 | 2 | 1 | 1 | 0 | 1 | 0 |
| 2 | 1 | 1 | 0 | 0 | 0 | 0 | 0 |
| 3 | 1 | 1 | 0 | 0 | 0 | 1 | 0 |
| 4 | 1 | 0 | 0 | 0 | 0 | 2 | 0 |
| 5 | 2 | 0 | 1 | 1 | 0 | 3 | 0 |
| 6 | 4 | 1 | 0 | 2 | 0 | 0 | 0 |
| 6 wk subtl | 12 | 5 | 2 | 4 | 0 | 7 | 0 |
| per gm avg | 2 | 0.833 | 0.33 | 0.7 | 0 | 1.1667 | 0 |
| week | tackles | assists | sacks | TFL | PD | QB hits | INT |
| 7 | 4 | 1 | 0 | 0 | 0 | 0 | 0 |
| 8 | 1 | 1 | 0 | 0 | 1 | 0 | 0 |
| 9 | 3 | 0 | 0 | 0 | 1 | 0 | 1 |
| 10 | 3 | 2 | 1.5 | 1 | 0 | 2 | 0 |
| 11 | 1 | 1 | 0 | 0 | 0 | 1 | 0 |
| 13 | 5 | 5 | 1 | 2 | 0 | 1 | 0 |
| 14 | 3 | 3 | 0 | 0 | 0 | 0 | 0 |
| 15 | 0 | 1 | 0 | 0 | 0 | 1 | 0 |
| 8 wk subtl | 20 | 14 | 2.5 | 3 | 2 | 5 | 1 |
| per gm avg | 2.5 | 1.75 | 0.31 | 0.4 | 0.25 | 0.625 | 0.125 |
| tackles | assists | sacks | TFL | PD | QB hits | INT |

Yeah, not real impressive, but to be complete, he did get robbed of one sack.